
The Fishbone Toolbox
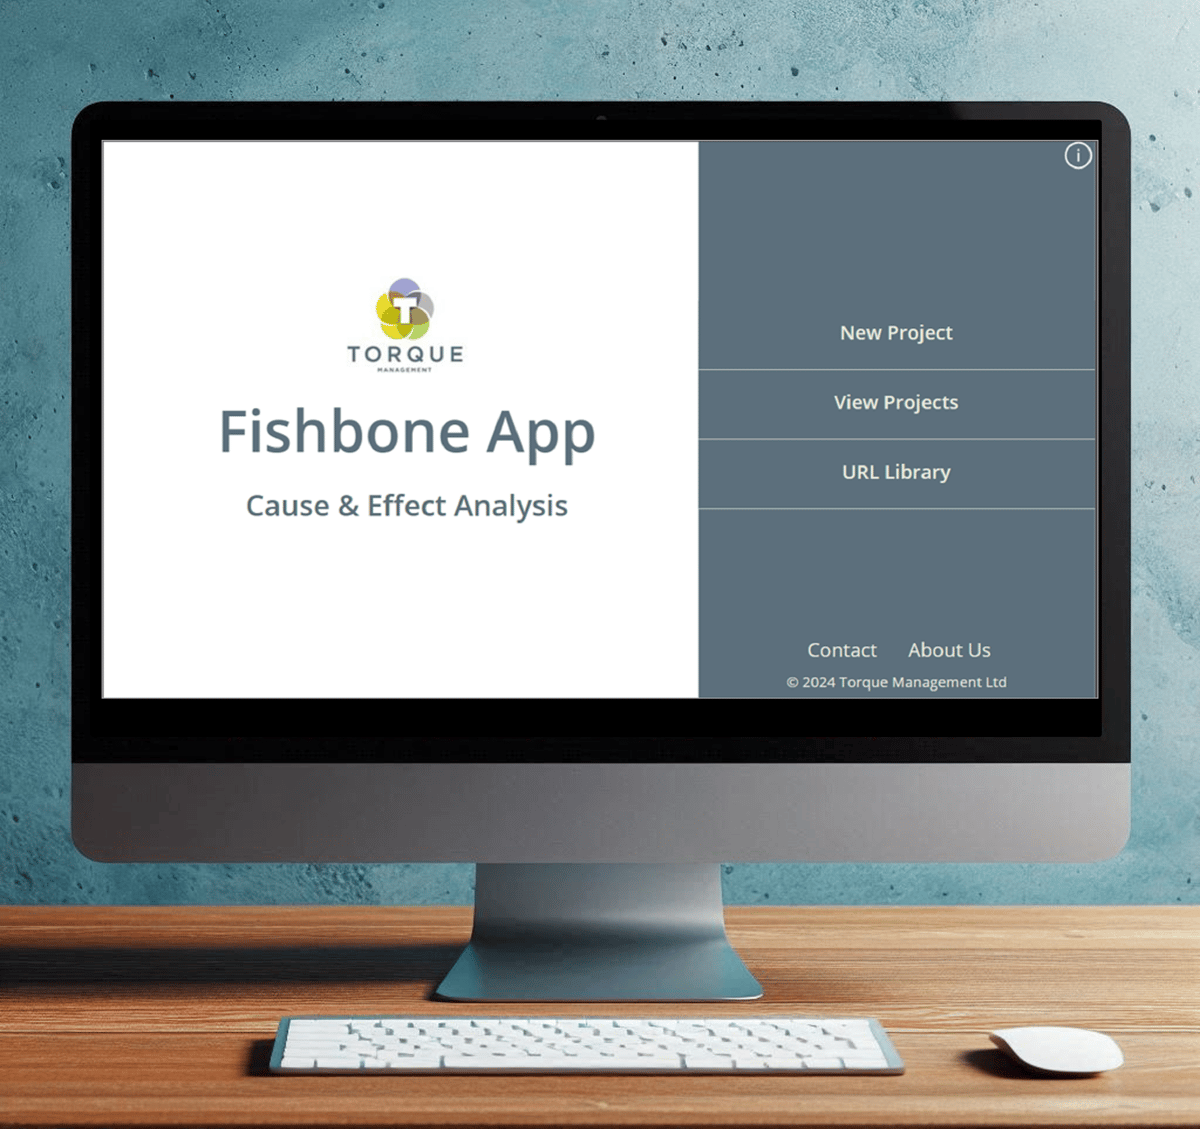
The Fishbone App
A Microsoft-certified Power App for structured, collaborative Fishbone Analysis
The Fishbone Course
Take the Fishbone Micro-Course - Learn the method in 10 minutes
Deepen your RCA knowledge
Download the RCA white paper.
Why Fishbone
The Fishbone (Ishikawa) Diagram is a structured method to explore and analyse possible causes of an undesired effect.
It helps teams brainstorm clearly, categorize ideas, and avoid jumping to conclusions.
Common in RCA, Fishbone is used across industries - from manufacturing and healthcare to IT and engineering.
Use it standalone or pair it with methods like 5 Whys, DMAIC, or PDCA.
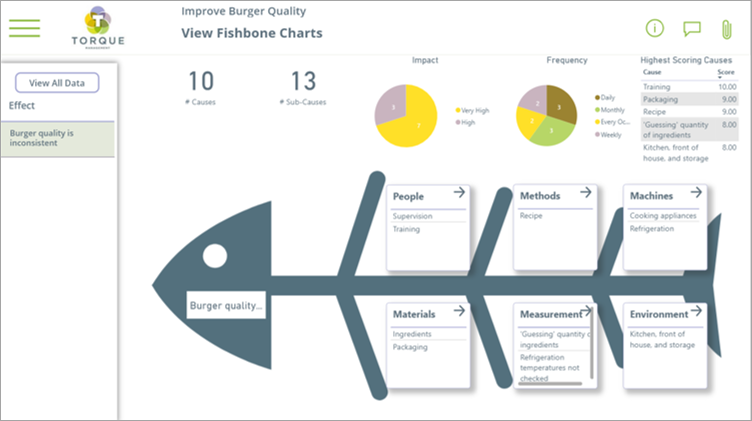
How the Fishbone App Works
Our Microsoft Power App takes your analysis digital - no whiteboards or sticky notes needed.
Guide live or asynchronous brainstorming
Categorize and rank possible causes by impact and frequency
Attach supporting evidence and documents
Share dashboards with stakeholders
Drill down for detailed analysis
Built for team collaboration - live or remote
Also included in the ANALYSE phase of our full DMAIC Power App.
See the App in Action!
Watch our short demo video to see how the app works in real RCA scenarios
FAQs
-
Yes, users will need:
A Microsoft Power Platform license to run the app.
A Microsoft Power BI License for charts and analyses.
-
On your own Microsoft Power Apps environment - on premises or cloud, so your data remains under your control.
-
Yes, the app supports multi-user, real-time collaboration.
-
You can choose:
Quality template: (Method, Machine, Materials...)
BPM template: (Input, Output, Guide...)
-
Not built-in - but you can link your causes to data or other methods.
For a full RCA workflow, check out our DMAIC App.